
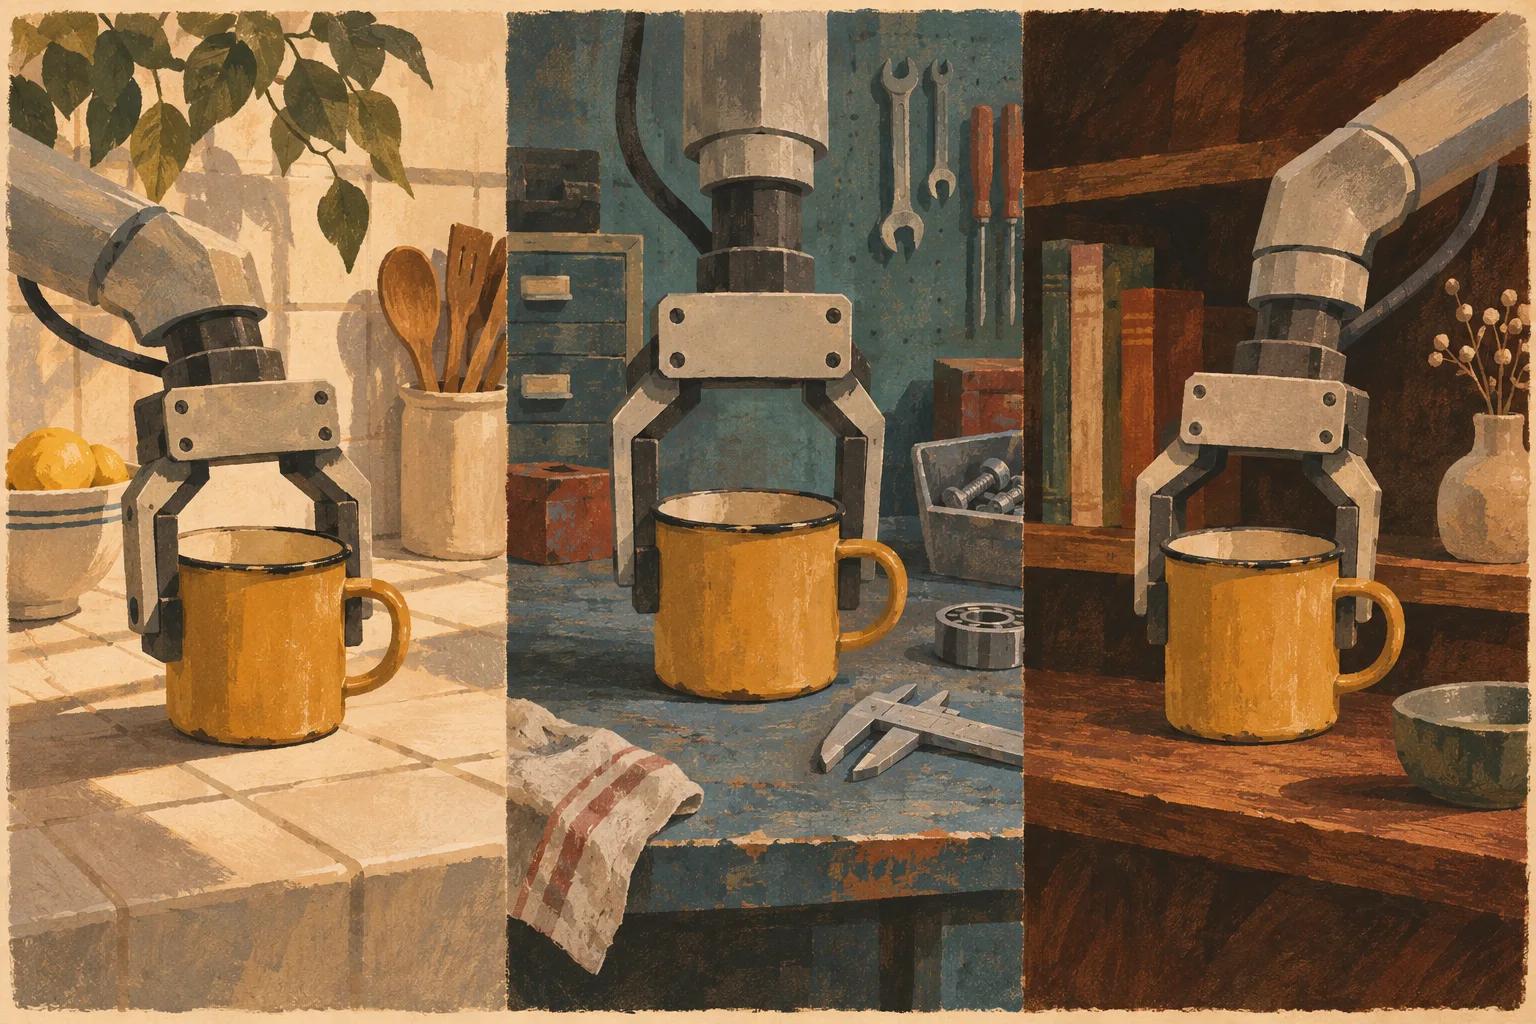
Imagine a robot learning to pick up a mug. A hundred recordings can show an ochre mug on the same counter under the same light. Or they can show the grasp on a tiled counter, a crowded workbench, and a shelf where the wrist camera loses sight of the handle. Both collections can carry the same task label. If the robot will work at that shelf, which recordings would you buy next?
Start with the conditions the robot has to handle. Then look at the delivery: how much usable footage remains after review, how often the same recording appears, and which conditions still have few examples. Hours tell you how much footage you have. This accounting tells you where to collect next.
At Avala we collect first-person video and report accepted hours, so we have a stake in how buyers count them. The strongest controlled studies use handheld grippers, teleoperated robots, and simulation. Their findings help frame a collection decision. How far they carry over to wearable human video remains an open question.
Hours are a weak proxy for coverage
The sharpest controlled scaling study comes from people recording demonstrations with a handheld gripper, not from robot teleoperation. Lin et al. (arXiv 2410.18647) used the Universal Manipulation Interface (arXiv 2402.10329), a gripper carried by hand, to collect more than 40,000 demonstrations, and tested the resulting policies in more than 15,000 real-robot runs. They studied how a policy, the learned controller that maps camera input to robot actions, generalizes to places and objects it has not seen. Success followed a roughly power-law relationship with the number of training environments and objects, and the authors concluded that "the diversity of environments and objects is far more important than the absolute number of demonstrations." With environments and objects held fixed, extra demonstrations stopped helping at about 400, 800, and 1,600 demonstrations for 8, 16, and 32 environment-object pairs. That is roughly 50 per pair, a figure the authors offer for tasks about as hard as theirs.
Teleoperation, where a person drives a robot to record demonstrations, shows the same pattern. DROID (arXiv 2403.12945) built two subsets of 7,362 trajectories each: one from the 20 scenes with the most data, the other a uniform random sample of a dataset that spans 564 scenes. Each was mixed half-and-half with task-specific demonstrations in training. The scene-diverse subset did better out of distribution, meaning in settings unlike its training data.
The π0.5 paper runs an equal-budget version of the test for mobile manipulation. Roughly 400 hours of its training data came from mobile robots in about 100 homes, a small part of a first-phase mix in which 97.6% of examples came from other sources. The authors then trained on data from 3, 12, 22, 53, 82, and 104 locations, with the number of training steps set so that each model saw the same number of unique samples. Performance in mock homes not seen in training generally rose with location count. Each added location brings new layouts and objects together, so location count is not isolated from what comes with it.
Two results keep this from being a one-way story. Shi et al. (arXiv 2507.06219) found that task breadth beat per-task volume, and also that variation between teleoperators can confuse a policy. The authors treat different spatial paths as useful strategies to keep. Inconsistent speeds were the problem: aligning action speed raised their average task completion score from 0.46 to 0.53, a 15% gain they equate to 2.5 times the pretraining data.
Volume still counts when breadth grows with it. EgoScale (arXiv 2602.16710) pretrained on up to 20,854 hours of egocentric human video (video from the wearer's own point of view) spanning 9,869 scenes and 6,015 tasks. Across runs from 1,000 to about 20,000 hours, validation loss (prediction error on held-out data) fell log-linearly with hours, and average robot task completion rose from 0.30 to 0.71. The paper does not report holding scenes or tasks fixed as hours grew, so the curve is best read as hours of diverse data, not hours in place of diversity.
Diversity does not replace hours. It decides what an hour is worth. We made the cost side of this argument in what robot data costs, and where budgets leak.
How diversity gets a number
Most published diversity numbers belong to one of four families, and each inherits the choices of whoever computed it.
| Measure | What it counts | What it misses |
|---|---|---|
| Label count | Distinct tasks, objects, actions, or scenes that someone labeled | Balance: one clip of a rare object counts as much as 10,000 of a mug |
| Effective number | How many equally common labels would give the same variety | Anything outside the label set, and how alike two labels are |
| Embedding score | How many distinct clips there are, by a trained model's sense of similarity | Whatever that model ignores |
| Coverage | Which cells in a grid of conditions have accepted data, and how thin each one is | Variety inside a cell, and any condition left off the grid |
None of the four knows what the buyer will test. Coverage comes closest, and only when the buyer's test defines the grid.
An effective number, introduced in ecology by Hill (1973) and extended by Leinster (arXiv 2012.02113), turns label shares into the number of equally common labels that would produce the same variety. Take 1,000 clips of one task plus one clip each of nine others. Counting labels gives 10. The usual entropy-based version gives about 1.07, and a version that weights common labels more heavily gives about 1.02. Which version was used is one more choice behind any published number.
The Vendi score (Friedman and Dieng, arXiv 2210.02410) works without labels. The scorer supplies a similarity function, usually built on embeddings (the vectors a trained model assigns to each clip), and the score is an effective number of distinct samples under that function. That freedom is also its limit. Change the model or the camera view and the ruler changes. The number of clips sets an upper bound on the score. For a like-for-like comparison, draw equally sized samples and use the same similarity function. As one recent paper on the subject puts it, "there is no widely accepted measure of diversity for robot datasets" (Sirigiri et al., arXiv 2603.11634).
Four adjustments to the raw number
Four adjustments turn a raw total into usable coverage, applied in order: count what was accepted, subtract what repeats, record and cap the capture axes, and map the result onto the buyer's test.
Count only what ships
Diversity measured over everything recorded includes footage a training pipeline cannot use. The authors of Do as I Do (arXiv 2606.19333) sampled 2,000 clips of 10 seconds each from 100DOH, a public dataset of everyday hand-object video, and found meaningful hand-object interaction in 187 of them. More than half of those then failed the quality check for 3D reconstruction: the hand or object left the frame in 41, the action stalled or crossed a shot cut in 29, and camera motion broke 14. That left 83 usable clips, about 4% of the sample.
If rejections cluster in harder conditions such as dim rooms, tight cabinets, or older phones, the recorded pool overstates variety in the cells a buyer may care about most. That is our reasoning, and we know of no published measurement of how much acceptance shifts measured diversity. It is a reason for suppliers to report rejection counts and reasons next to delivered volume.
DROID set a precedent for the accounting. Its authors labeled roughly 16,000 collected trajectories as not successful, released them, and did not count them toward the dataset's size of 76,000. The same split applies to failures in general. A file that cannot be decoded fails a technical check. A clear recording of a fumbled grasp and recovery may pass that check and give a team exactly the example it needs.
We bill and report on accepted hours only. An accepted hour is dense with manipulation, keeps the hands and the object in view, is calibrated and consented, and passes the program's written criteria and human review. Technical validity is recorded apart from behavioral outcome, so a filter for clean recordings does not drop a useful failure. When a criterion cannot be measured, the capture is quarantined for a reviewer, not rejected, and the machine's verdict is stored beside the human's, so agreement can be measured before the machine is trusted to decide. Rejected hours are reported next to accepted hours, with a reason for each.
Subtract what repeats
Repetition inflates volume in two ways. The first is the same recording arriving twice, across batches or across suppliers who draw on the same collection partners. We found no published figure for how often that happens, so a buyer combining suppliers has to check directly.
We fingerprint the video content of every sequence in a verified dataset release. Identical files are caught by hash. Re-encoded, trimmed, or cropped copies are caught by a perceptual fingerprint, a compact signature built on an open standard, so a buyer can detect the same footage across suppliers. Fingerprints are versioned, and each coverage report names the version and what was searched. Detecting the same activity in a different take is a separate measure, and it is in development.
The second kind of repetition is fresh footage that stalls or repeats patterns already in the data. SCIZOR (arXiv 2505.22626) filters 2-second chunks of visual and action data with two filters, one for chunks that show no task progress and one for near-duplicates, and reports an average gain of 15.4 percentage points across three benchmarks. Its ablation adds a caveat. At default settings the duplicate filter removed 0.3% to 4.5% of the data, against 4.7% to 29.3% for the progress filter. On Sirius-Fleet, a real-robot dataset, adding the duplicate filter to the progress filter lifted success from 64.2% to 79.6%. On simulated RoboMimic, the duplicate filter alone scored below deleting data at random, 74.3% against 78.0% on one task and 22.4% against 32.2% on the other. Removing repeats paid off on the fleet data and cost on the simulated benchmark.
Methods that rank whole demonstrations by their estimated effect on a policy point the same way. CUPID, from 2025, reports top results on the simulated RoboMimic benchmark from training "with less than 33% of curated data." ATHENA reached 68.0% average success across six real-robot tasks using 66.7% of a 6.90-hour set, against 60.0% for training on all of it. We covered both in our notes on the CoRL 2026 papers. Hours are not interchangeable, though extra takes still help up to a threshold.
Record the axes human capture adds
Task, object, and action labels miss much of what changes the pixels in first-person human video. A person wears the camera. Change the collector, the hands, the home, the phone, the lighting, or how the camera sits, and the picture changes while the activity label stays the same.
Benchmarks show how exposed policies are along these dimensions, and camera pose stands out in independent studies. In LIBERO-Plus (arXiv 2510.13626), Vision-Language-Action (VLA) models, which map camera images and a written instruction to robot actions, scored 95% and then fell below 30% under modest changes, including camera viewpoint and the robot's starting position. That was in simulation. An earlier factor-by-factor study on a real robot (Xie et al., arXiv 2307.03659) found new camera positions the hardest change to generalize to and new backgrounds the easiest.
Variety is not helpful in any amount, as the speed result above shows. Human-capture variety should be recorded, tagged with pace, and capped, not assumed to help without limit.
Not every cell of a grid needs filling, either. Gao et al. (arXiv 2403.05110) found that policies can combine factors they saw separately, which cuts the combinations a collection has to cover. On their real robot this depended on pretraining with prior robot datasets, and the resulting policy reached 77.5% success in new environments, against 2.5% for data collected without planning for variation.
In our briefed coverage programs, a coverage cell combines six dimensions (environment, mechanism, material, interaction primitive, failure mode, and embodiment), and the brief caps the share of accepted hours from any one location, operator, or mechanism. The coverage matrix our acceptance engine computes for app-based capture campaigns is narrower. Today its axes are subject (what the campaign asked for), collector (counted by pseudonymous ID), and device tier. A scene axis is in development there, and camera mount height and pitch are not yet an axis. Every value records whether it was declared or measured. Device heat, orientation, and ordinary shake are recorded as dimensions. Sustained shake, or a device that moved or fell, fails a capture check.
Tie the score to a test
Diversity scores can track success within one task. Sirigiri et al. report correlations of r = 0.74 to 1.00 between a trajectory-diversity score and policy success across subsets of simulated RoboMimic tasks. More is not always better. Luo et al. (arXiv 2606.20871) observed success rising and then falling as trajectory diversity grew, in simulation and on real robots, which they read as a trade-off between coverage and the difficulty of learning several strategies at once. A diversity score becomes a buying guide only when it is anchored to the target test.
Saxena et al. (arXiv 2506.13536) show this directly. After isolating the factors that mattered in simulation, they trained real-robot policies on the entire DROID dataset alongside 20 to 50 demonstrations of the target task. Success was 0% on all six tasks. Retrieving only the DROID trajectories that matched the target's object and skill, plus either its camera position (within 20 cm on two axes and 10 cm on the third) or its workspace (a 60 by 60 by 30 cm region), raised success as high as 85%. That was up to 70 percentage points above retrieval by object and skill alone, and up to 80 above the target demonstrations alone.
Factored Scaling Curves (arXiv 2505.07728) take the next step: measure how performance scales along each factor or pair of factors, then spend a fixed collection budget where the curve is steepest. The authors report gains of up to 26% in success on real-world tasks in new environments over existing collection strategies.
We argued in You can't rent experience that a robot company should own its tests. That test decides which cells are worth paying for. It also needs clean splits. Our sequence metadata carries pseudonymous leakage groups for location, object set, mechanism, operator, and environment family, so the same home or collector does not land on both sides of a training and evaluation split.
The strongest case against us
A buyer who puts raw hours per dollar first has three serious arguments.
First, EgoScale's scaling law held on camera-motion and hand-pose labels its own authors call noisy, and curation methods such as SCIZOR and ATHENA let a buyer filter a large pool downstream with its own model.
Second, upstream rules carry threshold risk. A strict cut for manipulation density can strip the setup and transition context a long-horizon policy needs.
Third, the buyer's base model decides whether human-video variety transfers at all. Kareer et al. (arXiv 2512.22414) found that egocentric human video helped a robot policy only once its robot pretraining was diverse enough. At 0% and 25% of pretraining diversity, adding human data did not help, and on one task there was no gain up to 50%, with possible negative transfer.
Our answer is specific about what upstream checks solve. No downstream filter rescues an unreadable file, missing consent, or a duplicate clip. Technical validity is recorded apart from task outcome, so a recovery is not thrown out for being a failure. Rejected hours are reported with a reason for each, so a buyer can see what was filtered. The context risk gets settled in the brief, which states how waiting inside a task is handled.
Even so, we have not published a head-to-head comparison showing that our acceptance gate beats post-hoc curation alone at equal spend. And a buyer early in robot pretraining may get less from human-video variety than a team with a mature generalist model.
Because no common ruler exists across suppliers, the fair comparison is one the buyer runs: every supplier's accepted delivery through the same model, the same leakage check, and a coverage grid built from the buyer's test.
What to ask a data supplier
Ask for a coverage table for the delivery you are evaluating. Give each test condition its own row, with recorded hours, accepted hours after duplicate removal, distinct setups, and the most common rejection reason. An empty row is useful: it identifies a condition to collect or to leave explicitly outside the evaluation.
- What is the denominator? Hours recorded or hours accepted against a written brief, rejection rates by condition, and whether task failures and recoveries are delivered with labels or dropped.
- What repeats, and what concentrates? How re-encoded or trimmed duplicates are detected across batches, and what caps limit the share from any one home or collector.
- Which axes are measured, and which declared? Whether camera pose, pace, lighting, collector, and device fields come from a sensor or from a person's report.
- What sits behind any score? The label set, the version of the effective number, the encoder, the camera view, and the sample size.
- Coverage of what, and with what split hygiene? How delivered cells map to your camera geometry and workspace, and which group IDs keep the same home, collector, or object out of both training and test data.
- How does it differ from my other sources? Pooled datasets can teach a policy shortcuts when sources differ systematically (arXiv 2508.06426), so compare camera, device, and operator distributions across suppliers, not only duplicates.
What is still open
Within one benchmark, trajectory-diversity scores can track policy success, and past a point more spread can lower it. We found no published study that ties one diversity score to policy performance across independent datasets from different suppliers, which is the comparison a buyer faces.
In first-person human video, the fixed-budget trade between more hours per home and more homes, people, and phone models has not been measured on real robots, as far as we found. Kareer et al. did not vary the diversity of the human data. Detecting the same household activity across distinct takes, reliably and at scale, is also open.
Return to the mug on the shelf. If the held-out test includes a partially hidden handle, look for accepted training examples of that condition in other locations. If every such example came from the test kitchen, a good score cannot tell you whether the robot learned the grasp or recognized the room. That distinction is worth settling before buying another hour.
The results above are author-reported, from peer-reviewed papers and preprints. This is our reading of them, not an independent reproduction.
Measuring this on your own data? We would like to compare notes.